Profiling Memory
Understanding Worker memory usage can help you optimize performance, avoid Out of Memory (OOM) errors when hitting Worker memory limits, and fix memory leaks.
You can profile memory usage with snapshots in DevTools. Memory snapshots let you view a summary of memory usage, see how much memory is allocated to different data types, and get details on specific objects in memory.
When using DevTools to profile memory, it may be difficult to replicate specific behavior you are seeing in production. To mimic production behavior, make sure the requests you send to the local Worker are similar to requests in production. This might mean sending a large volume of requests, making requests to specific routes, or using production-like data with the --remote flag.
To generate a memory snapshot:
- Run
wrangler devto start your Worker - Hit d from your terminal to open DevTools
- Click on the "Memory" tab
- Send requests to your Worker to start allocating memory
- Optionally include a debugger to make sure you can pause execution at the proper time
- Click
Take snapshot
You can now inspect Worker memory.
Let's look at an example to learn how to read a memory snapshot. Imagine you have the following Worker:
let responseText = "Hello world!";
export default {  async fetch(request, env, ctx) {    let now = new Date().toISOString();    responseText = responseText + ` (Requested at: ${now})`;    return new Response(responseText.slice(0, 53));  },};
While this code worked well initially, over time you notice slower responses and Out of Memory errors. Using DevTools, you can find out if this is a memory leak.
First, as mentioned above, you open DevTools by hitting d after running wrangler dev.
Then, you navigate to the "Memory" tab.
Next, generate a large volume of traffic to the Worker by sending requests. You can do this with curl or by
repeatedly reloading the browser. Note that other Workers may require more specific requests to reproduce
a memory leak.
Then, click the "Take Snapshot" button and view the results.
First, navigate to "Statistics" in the dropdown to get a general sense of what takes up memory.
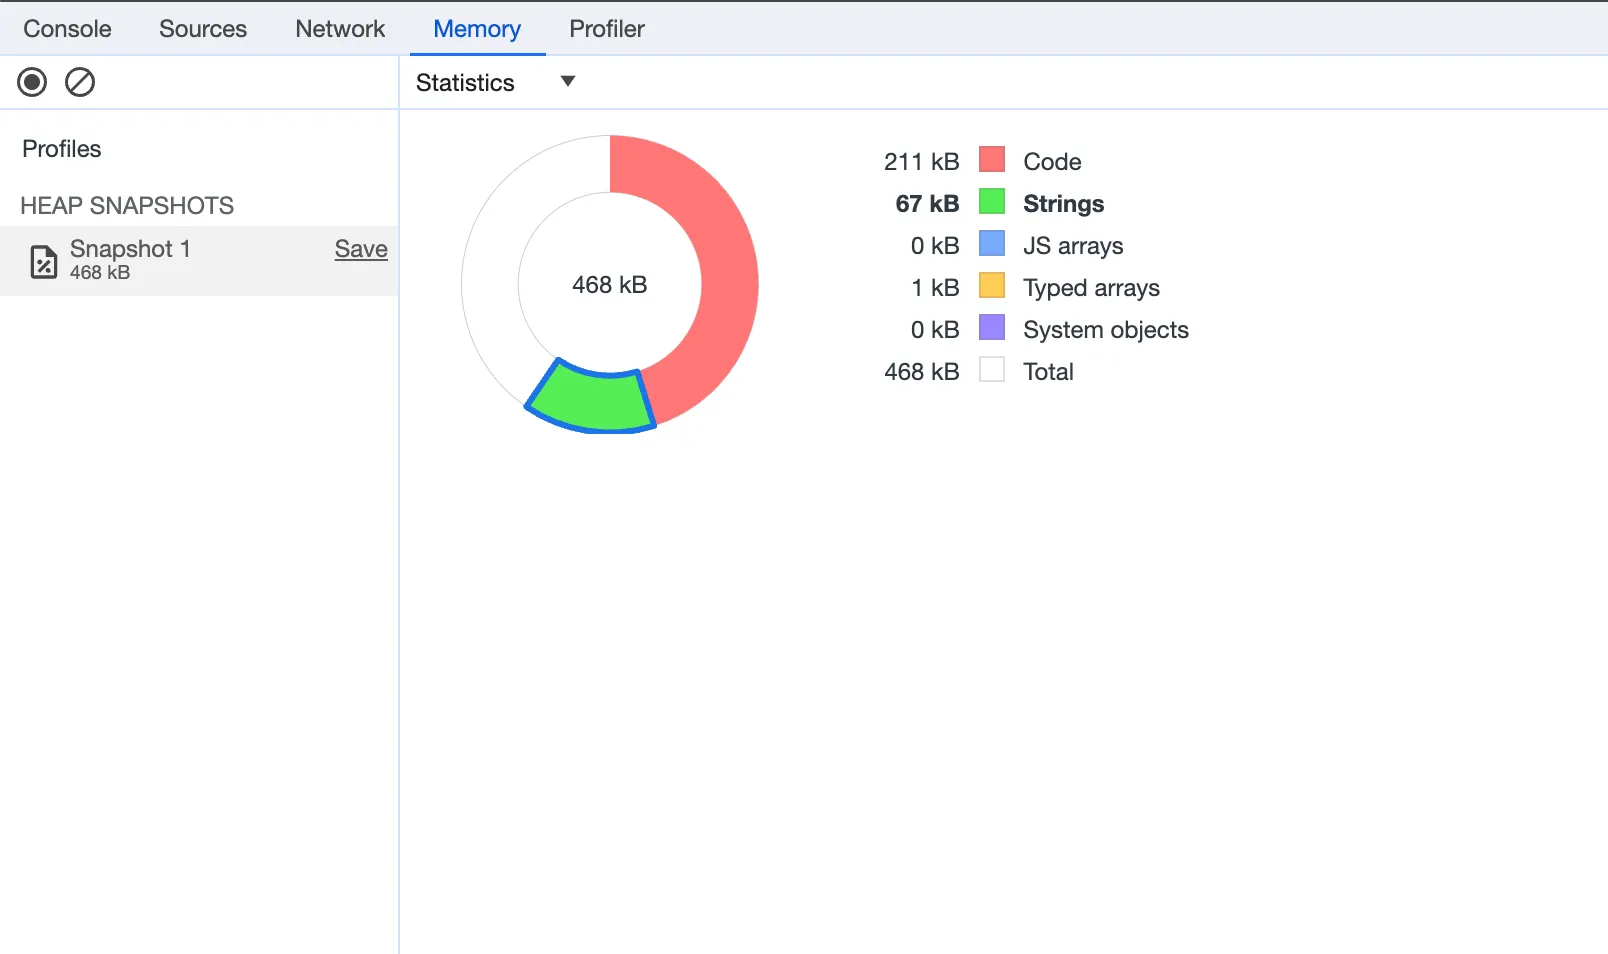
Looking at these statistics, you can see that a lot of memory is dedicated to strings at 67 kB. This is likely the source of the memory leak. If you make more requests and take another snapshot, you would see this number grow.
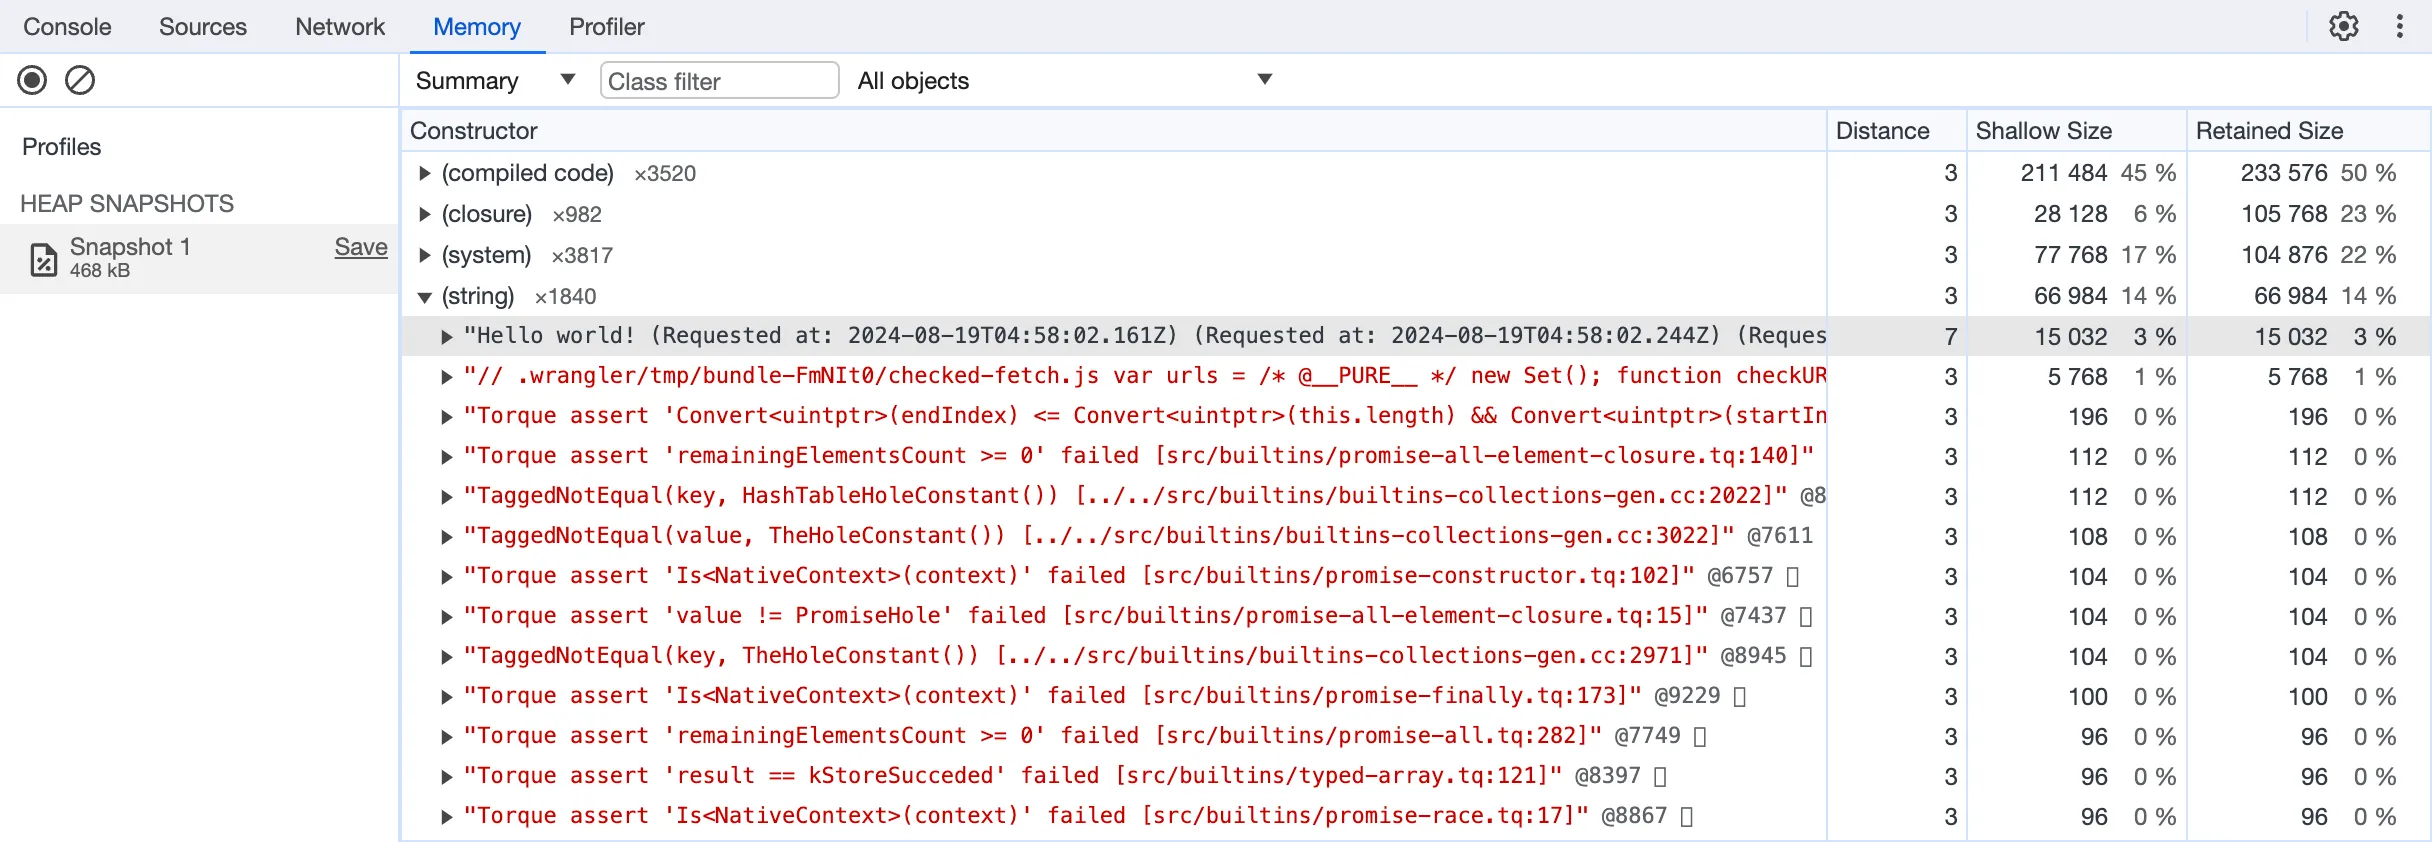
The memory summary lists data types by the amount of memory they take up. When you click into "(string)", you can see a string that is far larger than the rest. The text shows that you are appending "Requested at" and a date repeatedly, inadvertently overwriting the global variable with an increasingly large string:
responseText = responseText + ` (Requested at: ${now})`;Using Memory Snapshotting in DevTools, you've identified the object and line of code causing the memory leak. You can now fix it with a small code change.
To learn more about how to use Memory Snapshotting, see Google's documentation on Memory Heap Snapshots ↗.
To learn how to use DevTools to gain insight into CPU usage, see the CPU Profiling Documentation.