Profiling CPU usage
If a Worker spends too much time performing CPU-intensive tasks, responses may be slow or the Worker might fail to startup due to time limits.
Profiling in DevTools can help you identify and fix code that uses too much CPU.
Measuring execution time of specific functions in production can be difficult because Workers only increment timers on I/O for security purposes. However, measuring CPU execution times is possible in local development with DevTools.
When using DevTools to monitor CPU usage, it may be difficult to replicate specific behavior you are seeing in production. To mimic production behavior, make sure the requests you send to the local Worker are similar to requests in production. This might mean sending a large volume of requests, making requests to specific routes, or using production-like data with the --remote flag.
To generate a CPU profile:
- Run
wrangler devto start your Worker - Hit d from your terminal to open DevTools
- Click on the "Profiler" tab
- Click
Startto begin recording CPU usage - Send requests to your Worker from a new tab
- Click
Stop
You now have a CPU profile.
Let's look at an example to learn how to read a CPU profile. Imagine you have the following Worker:
const addNumbers = (body) => {  for (let i = 0; i < 5000; ++i) {    body = body + " " + i;  }  return body;};
const moreAddition = (body) => {  for (let i = 5001; i < 15000; ++i) {    body = body + " " + i;  }  return body;};
export default {  async fetch(request, env, ctx) {    let body = "Hello Profiler! - ";    body = addNumbers(body);    body = moreAddition(body);    return new Response(body);  },};
You want to find which part of the code causes slow response times. How do you use DevTool profiling to identify the CPU-heavy code and fix the issue?
First, as mentioned above, you open DevTools by hitting d after running wrangler dev. Then, you
navigate to the "Profiler" tab and take a profile by pressing Start and sending a request.
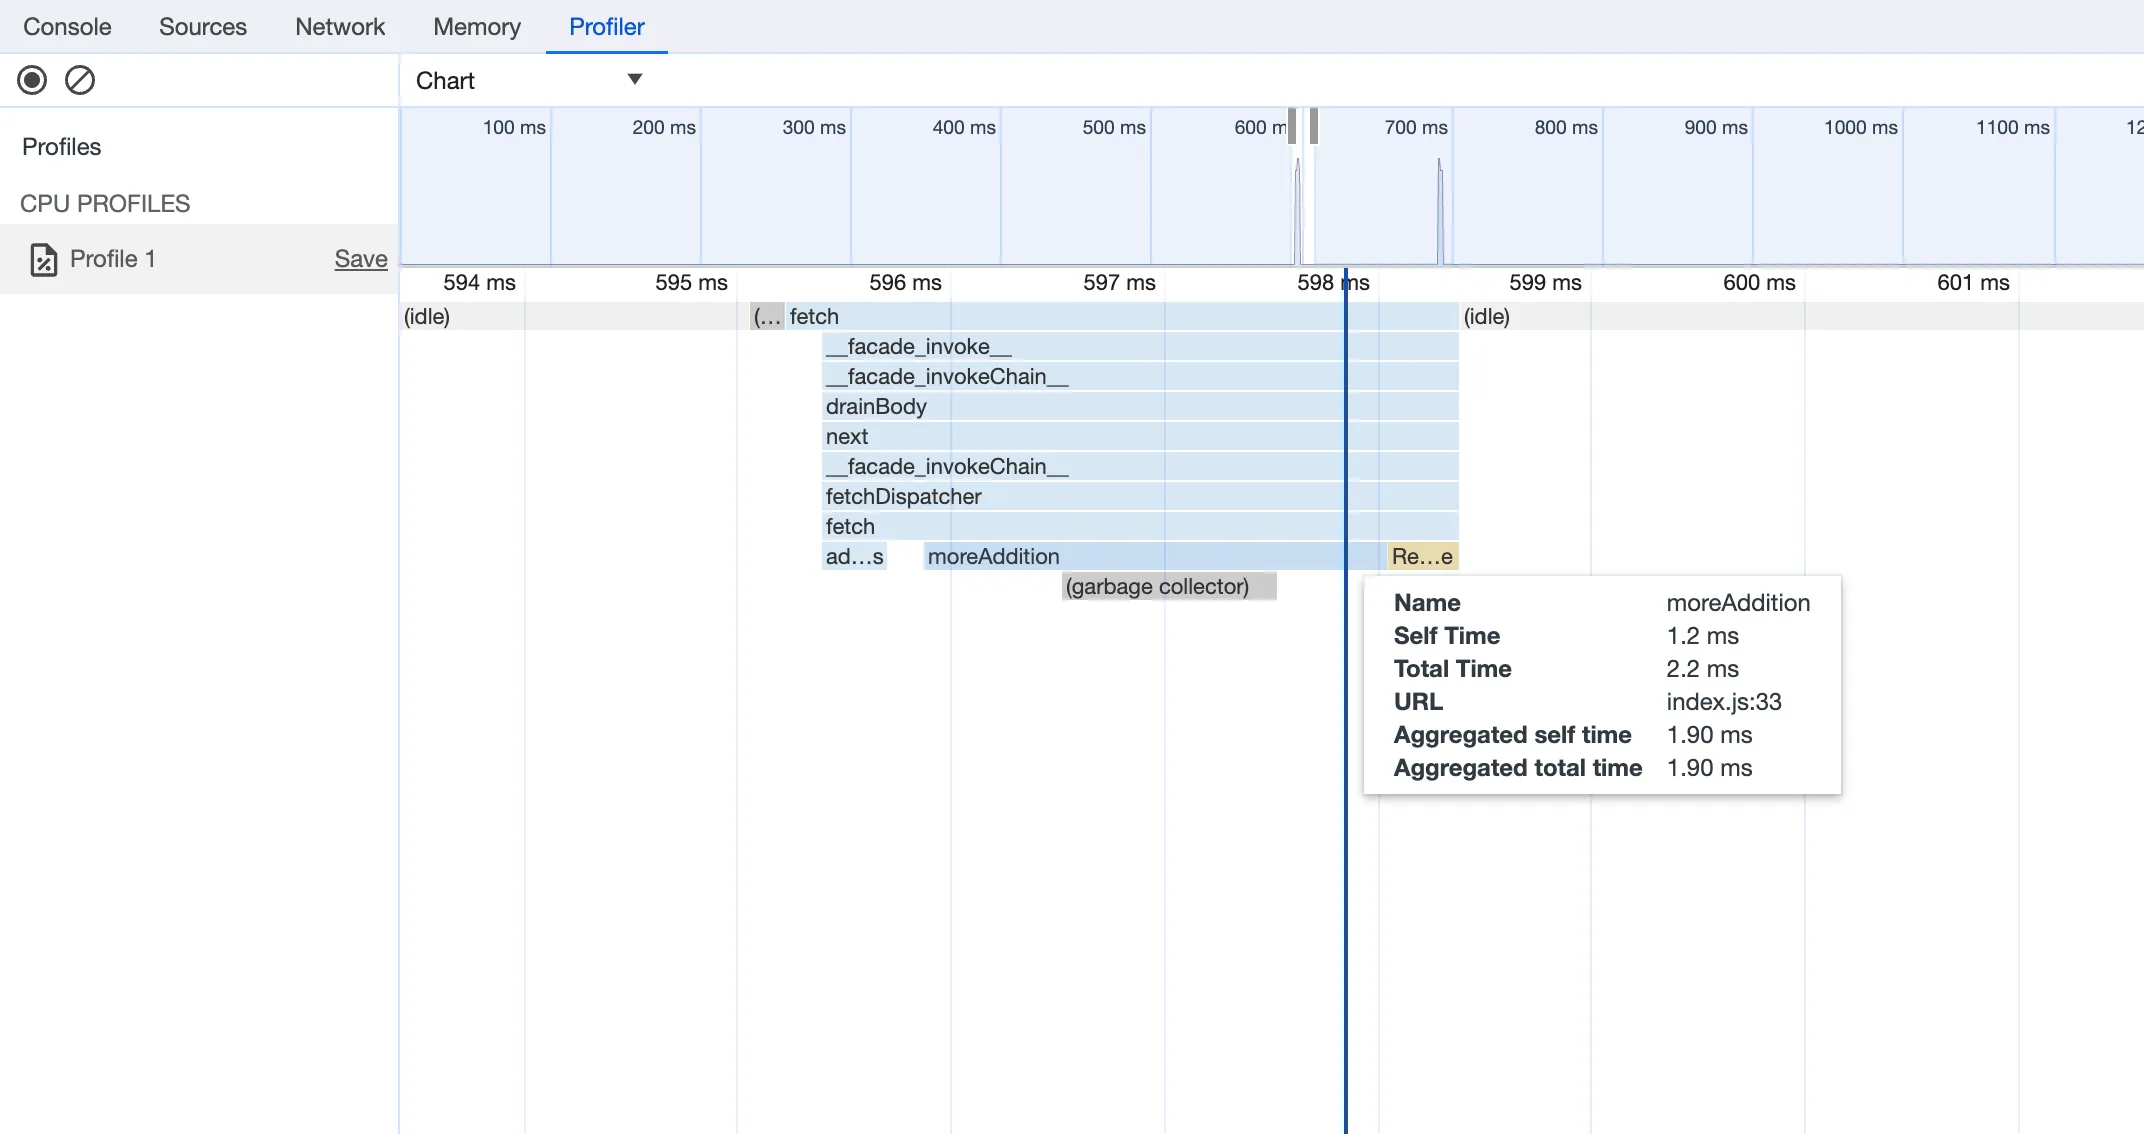
The top chart in this image shows a timeline of the profile, and you can use it to zoom in on a specific request.
The chart below shows the CPU time used for operations run during the request. In this screenshot, you can see
"fetch" time at the top and the subscomponents of fetch beneath, including the two functions addNumbers and
moreAdditions. By hovering over each box, you get more information, and by clicking the box, you navigate
to the function's source code.
Using this graph, you can answer the question of "what is taking CPU time?". The addNumbers function has
a very small box, representing 0.3ms of CPU time. The moreAdditions box is larger, representing 2.2ms of CPU time.
Therefore, if you want to make response times faster, you need to optimize moreAdditions.
You can also change the visualization from ‘Chart’ to ‘Heavy (Bottom Up)’ for an alternative view.
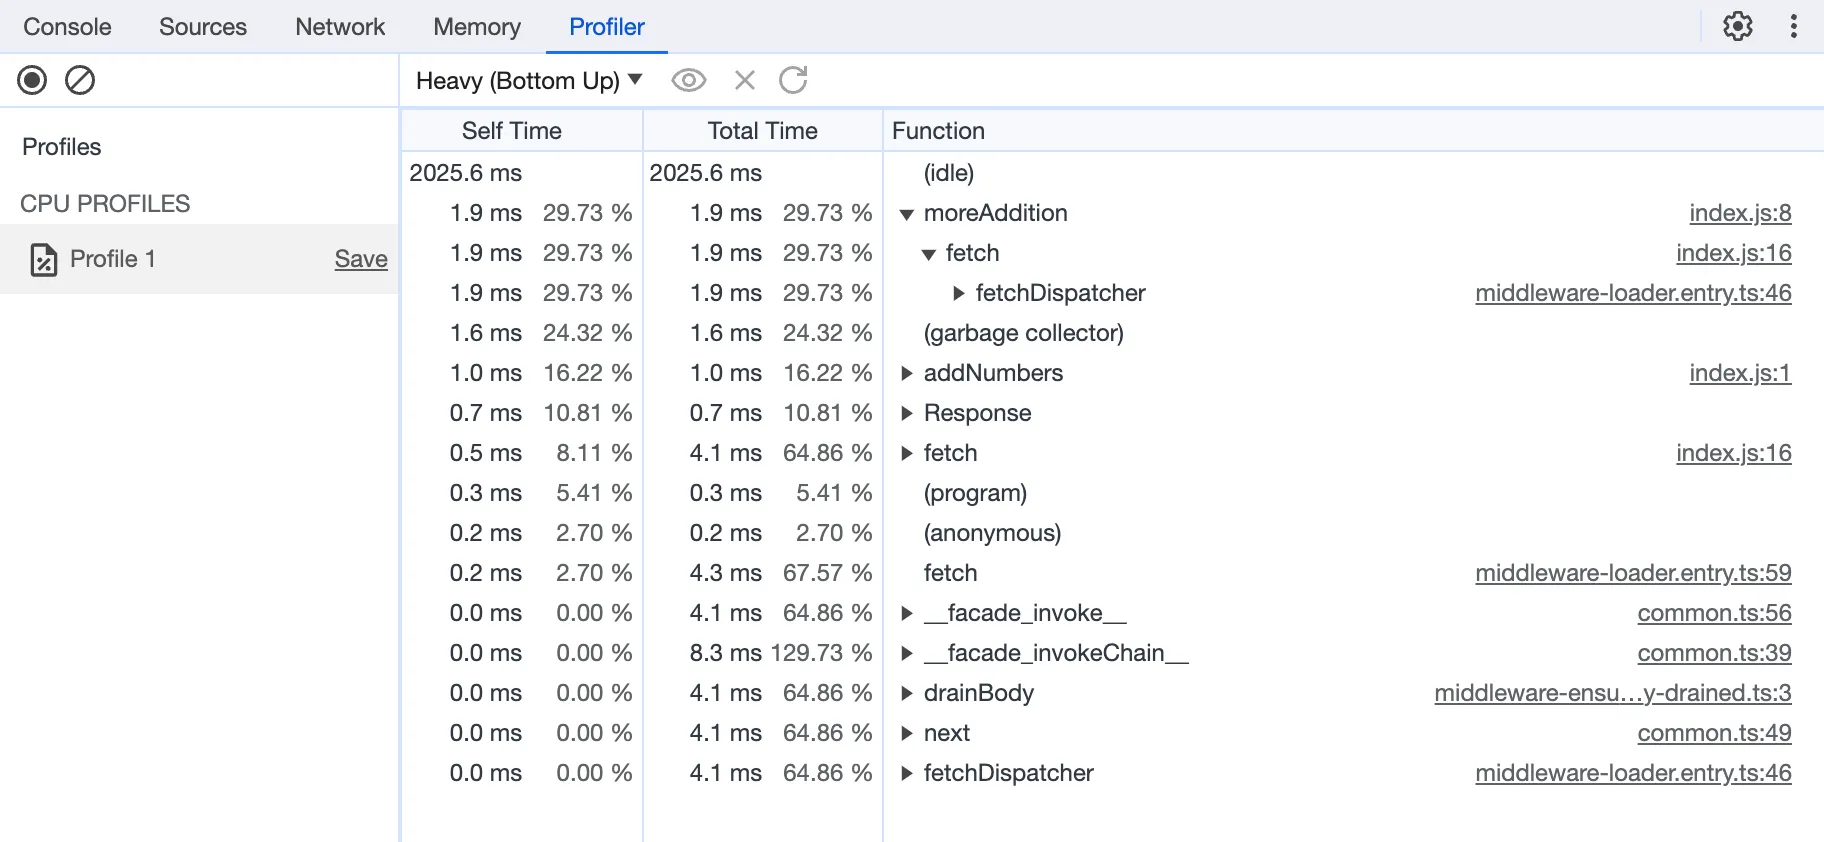
This shows the relative times allocated to each function. At the top of the list, moreAdditions is clearly the
slowest portion of your Worker. You can see that garbage collection also represents a large percentage of time, so
memory optimization could be useful.
To learn more about how to use the CPU profiler, see Google's documentation on Profiling the CPU in DevTools ↗.
To learn how to use DevTools to gain insight into memory, see the Memory Usage Documentation.